Clinicians couldn’t tell if they were paid fairly. I designed a way to find out.
- Offcall
- Physician-founded clinician network. Referrals, messaging, and discoverable professional communities.
- Role
- Founding product designer. I owned all design and research.
- Platform
- Web
- Dates
- November 2024 – June 2025
- Growth
- Offcall grew to more than 7,400 clinicians within 16 months of launch, three times its year-one goal.
Clinicians aren’t short of pay data. Surveys come out every year, ranked by specialty, but they assume everyone does the same job, so they can’t say whether one clinician’s pay is fair. The question came up in six of the seven clinician interviews I ran, some before the design and some after launch.
Those big surveys are … all assuming you’re working full-time, but what’s full-time for a neurosurgeon versus whatever?
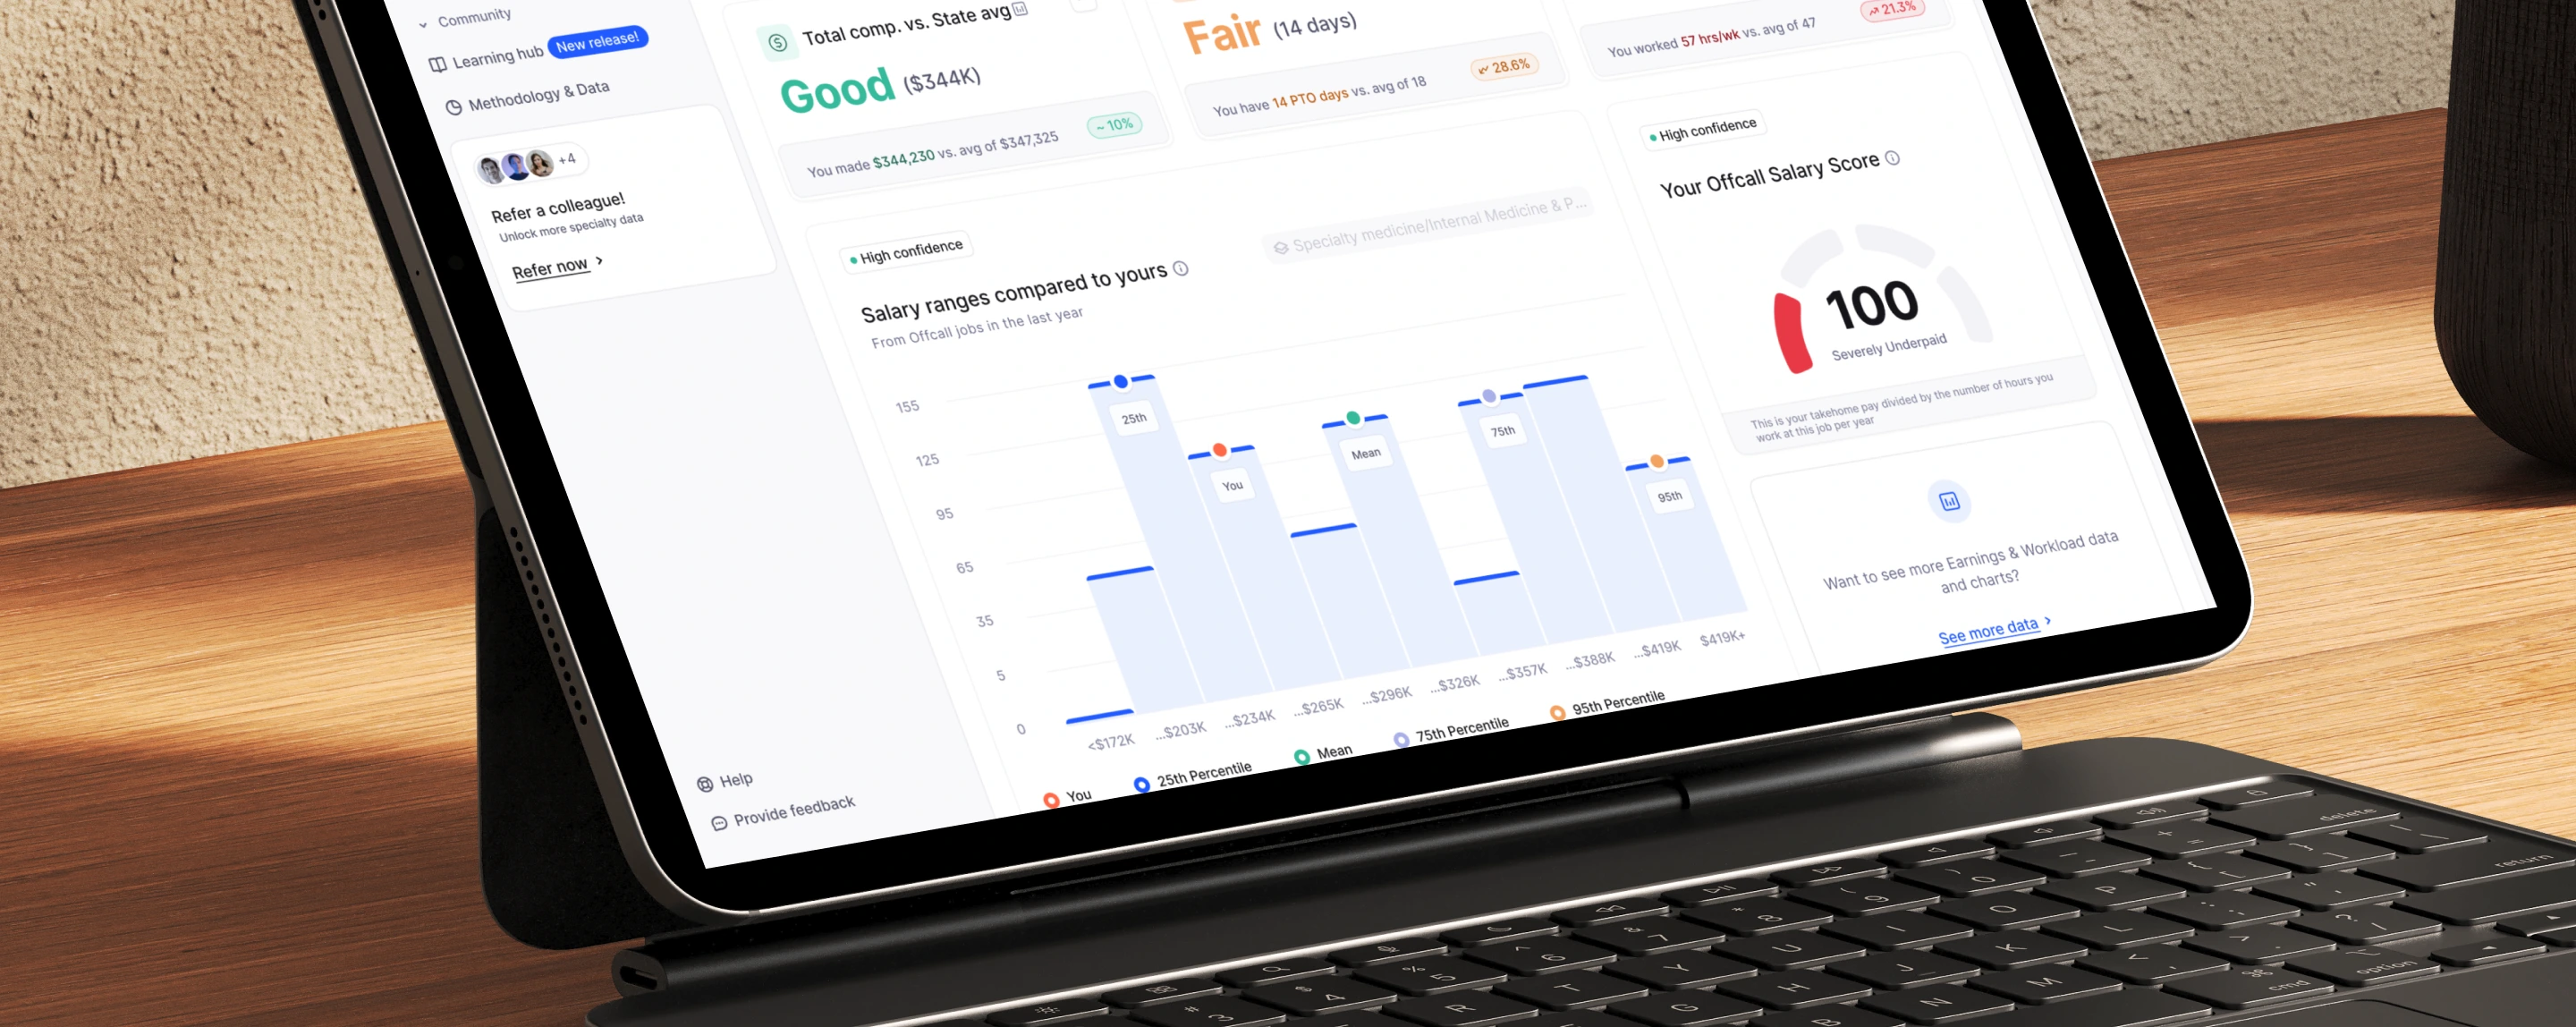
The dashboard had two questions to answer, in order. Who is this clinician being compared to? And is their pay good?
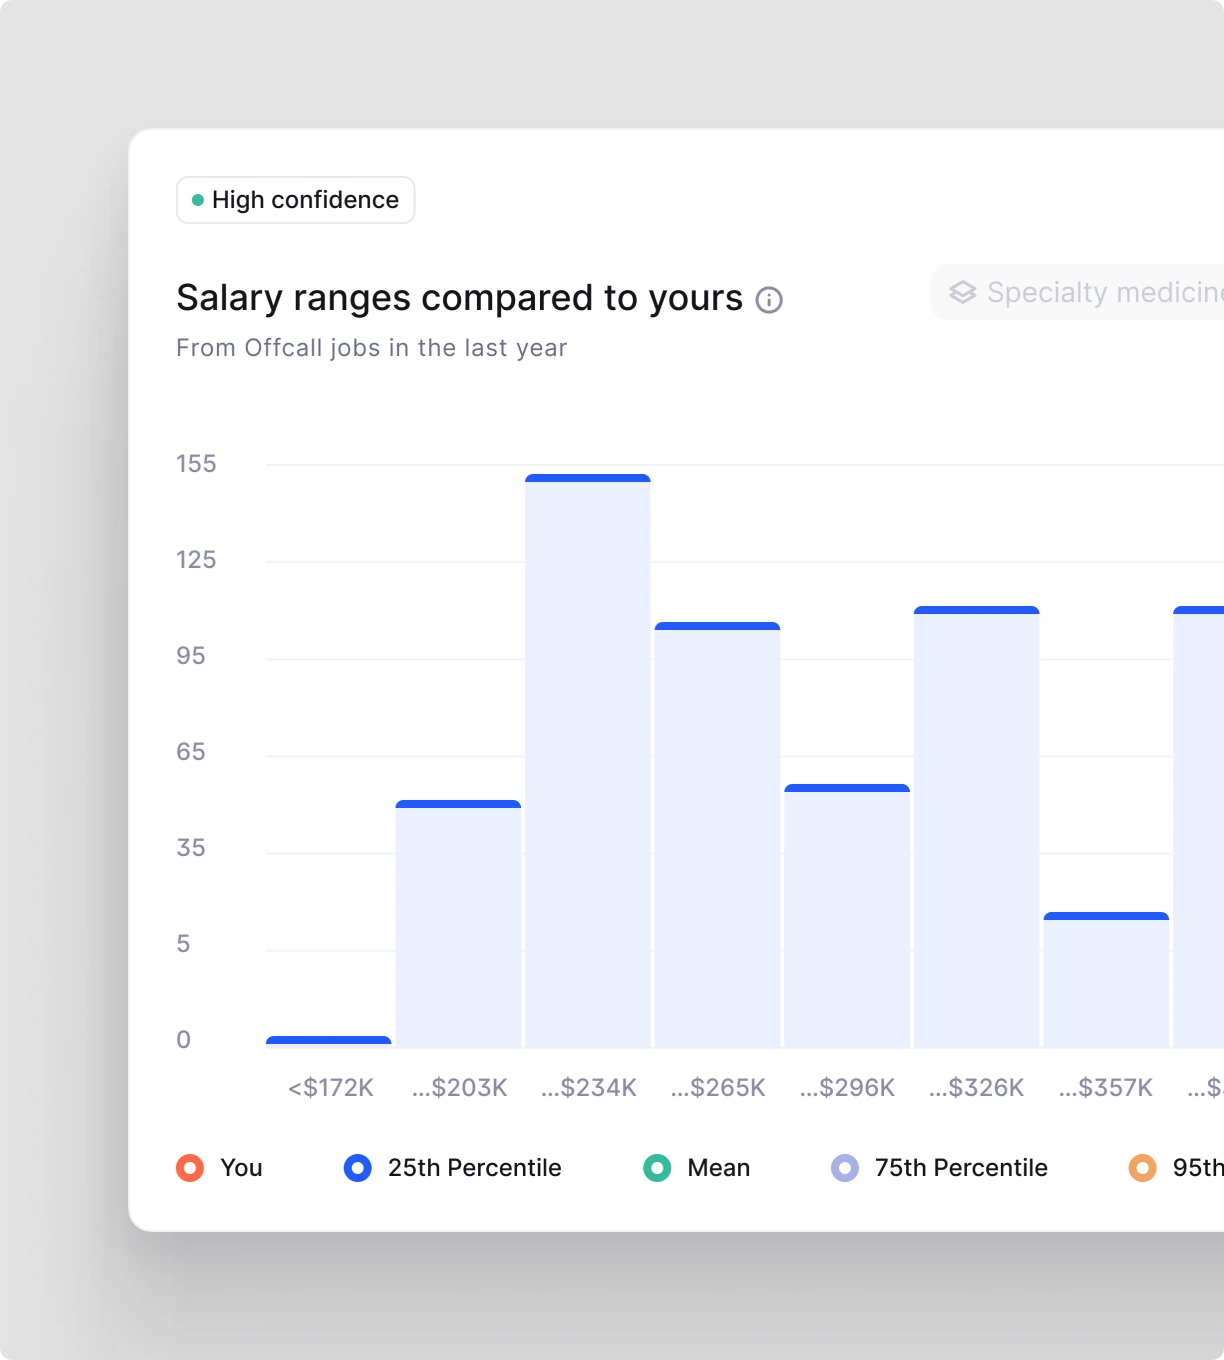
The first needs to know what the job is, not just what it pays, so the dashboard asks about all of it: base salary, bonuses, stock options, vacation time, hours and working conditions. It compares a clinician with peers in similar jobs: similar hours, similar pay, similar health systems. Peers are always an aggregate, never a named person.
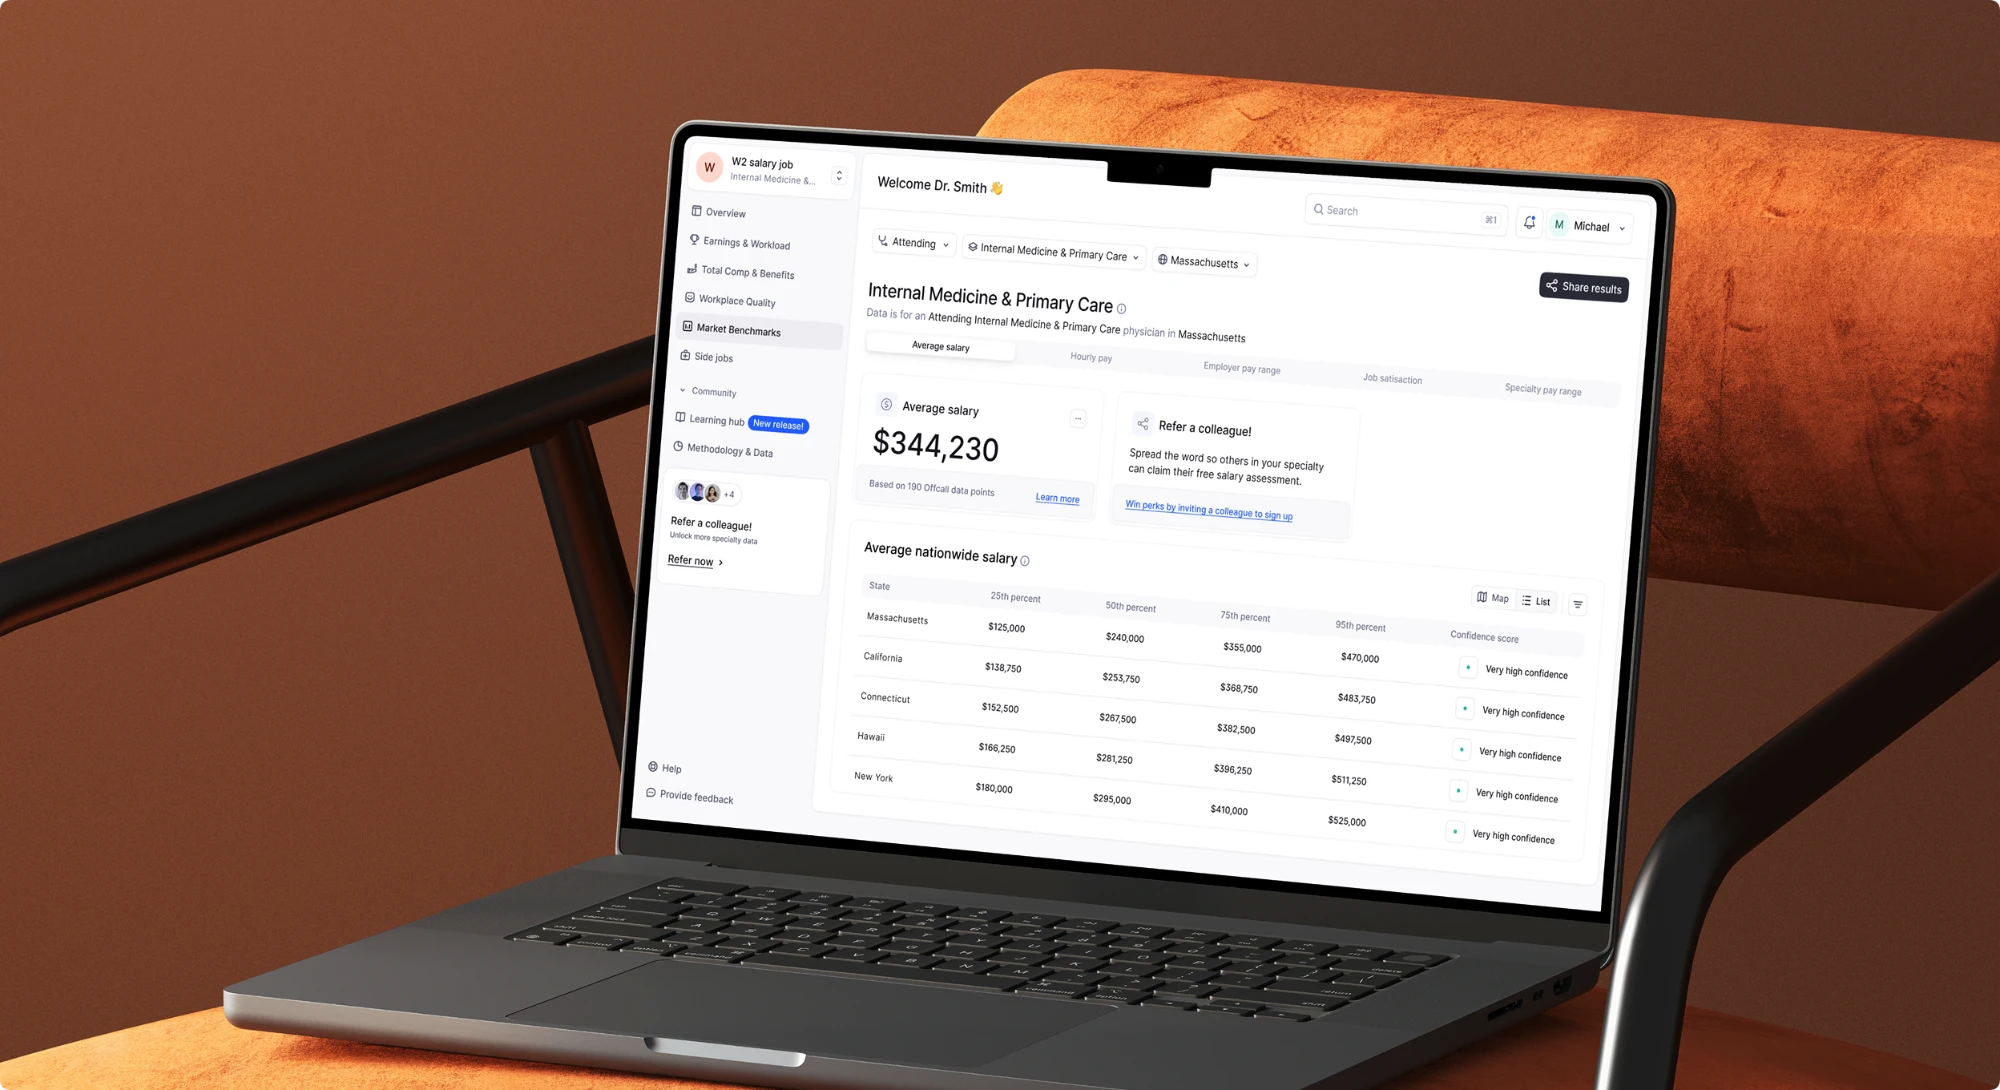
Filters let a clinician take that comparison wherever they want: against everyone, their own specialty or another one, several specialties at once to see how their pay ranks, or different health systems. The point was to let someone test how fair their pay is from more than one angle.
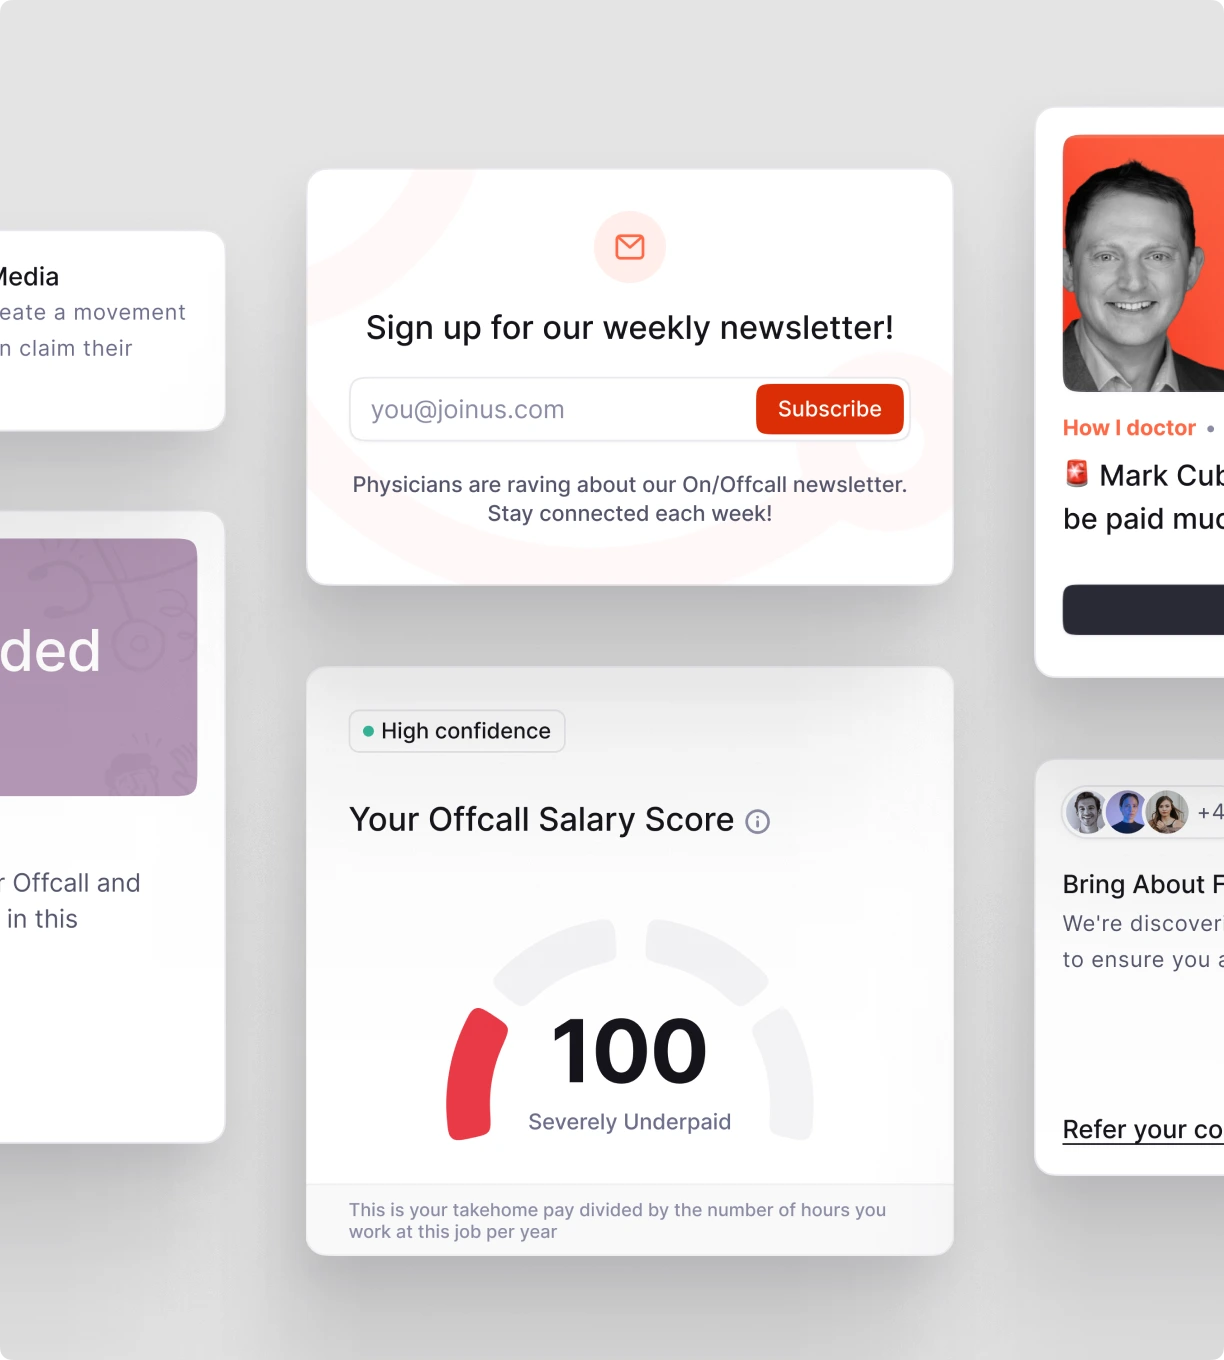
Each answer carries a confidence label explaining how it was calculated: the more clinicians have shared their information, the higher the confidence.
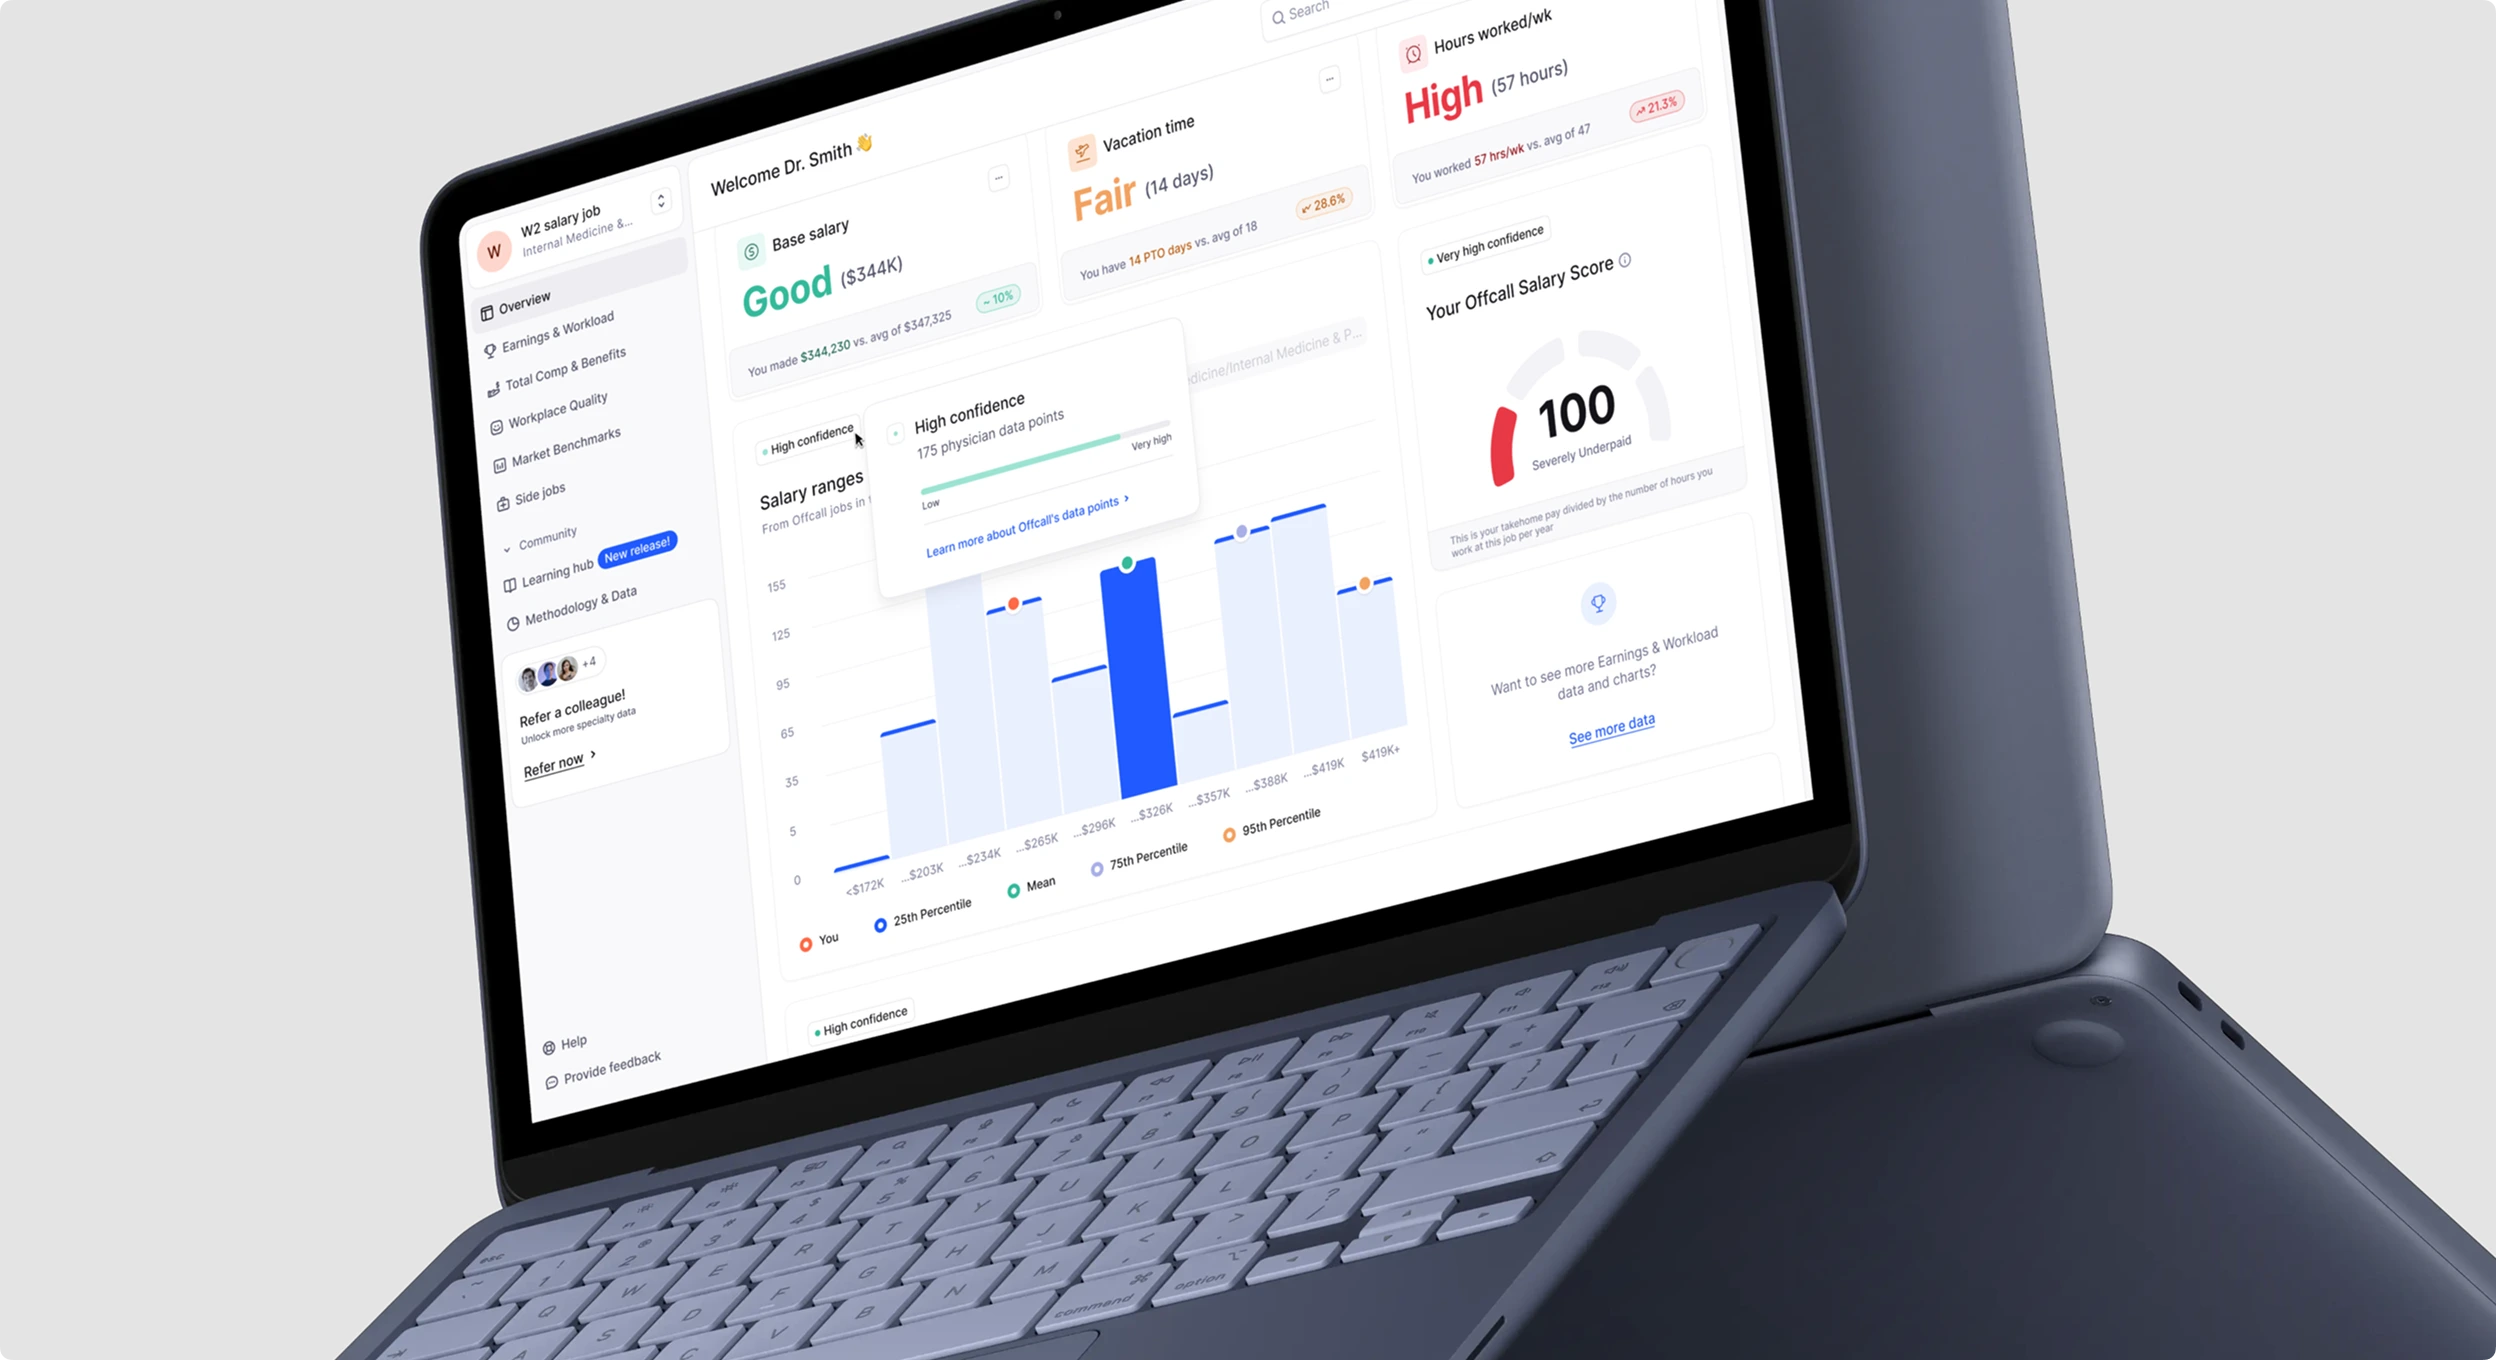
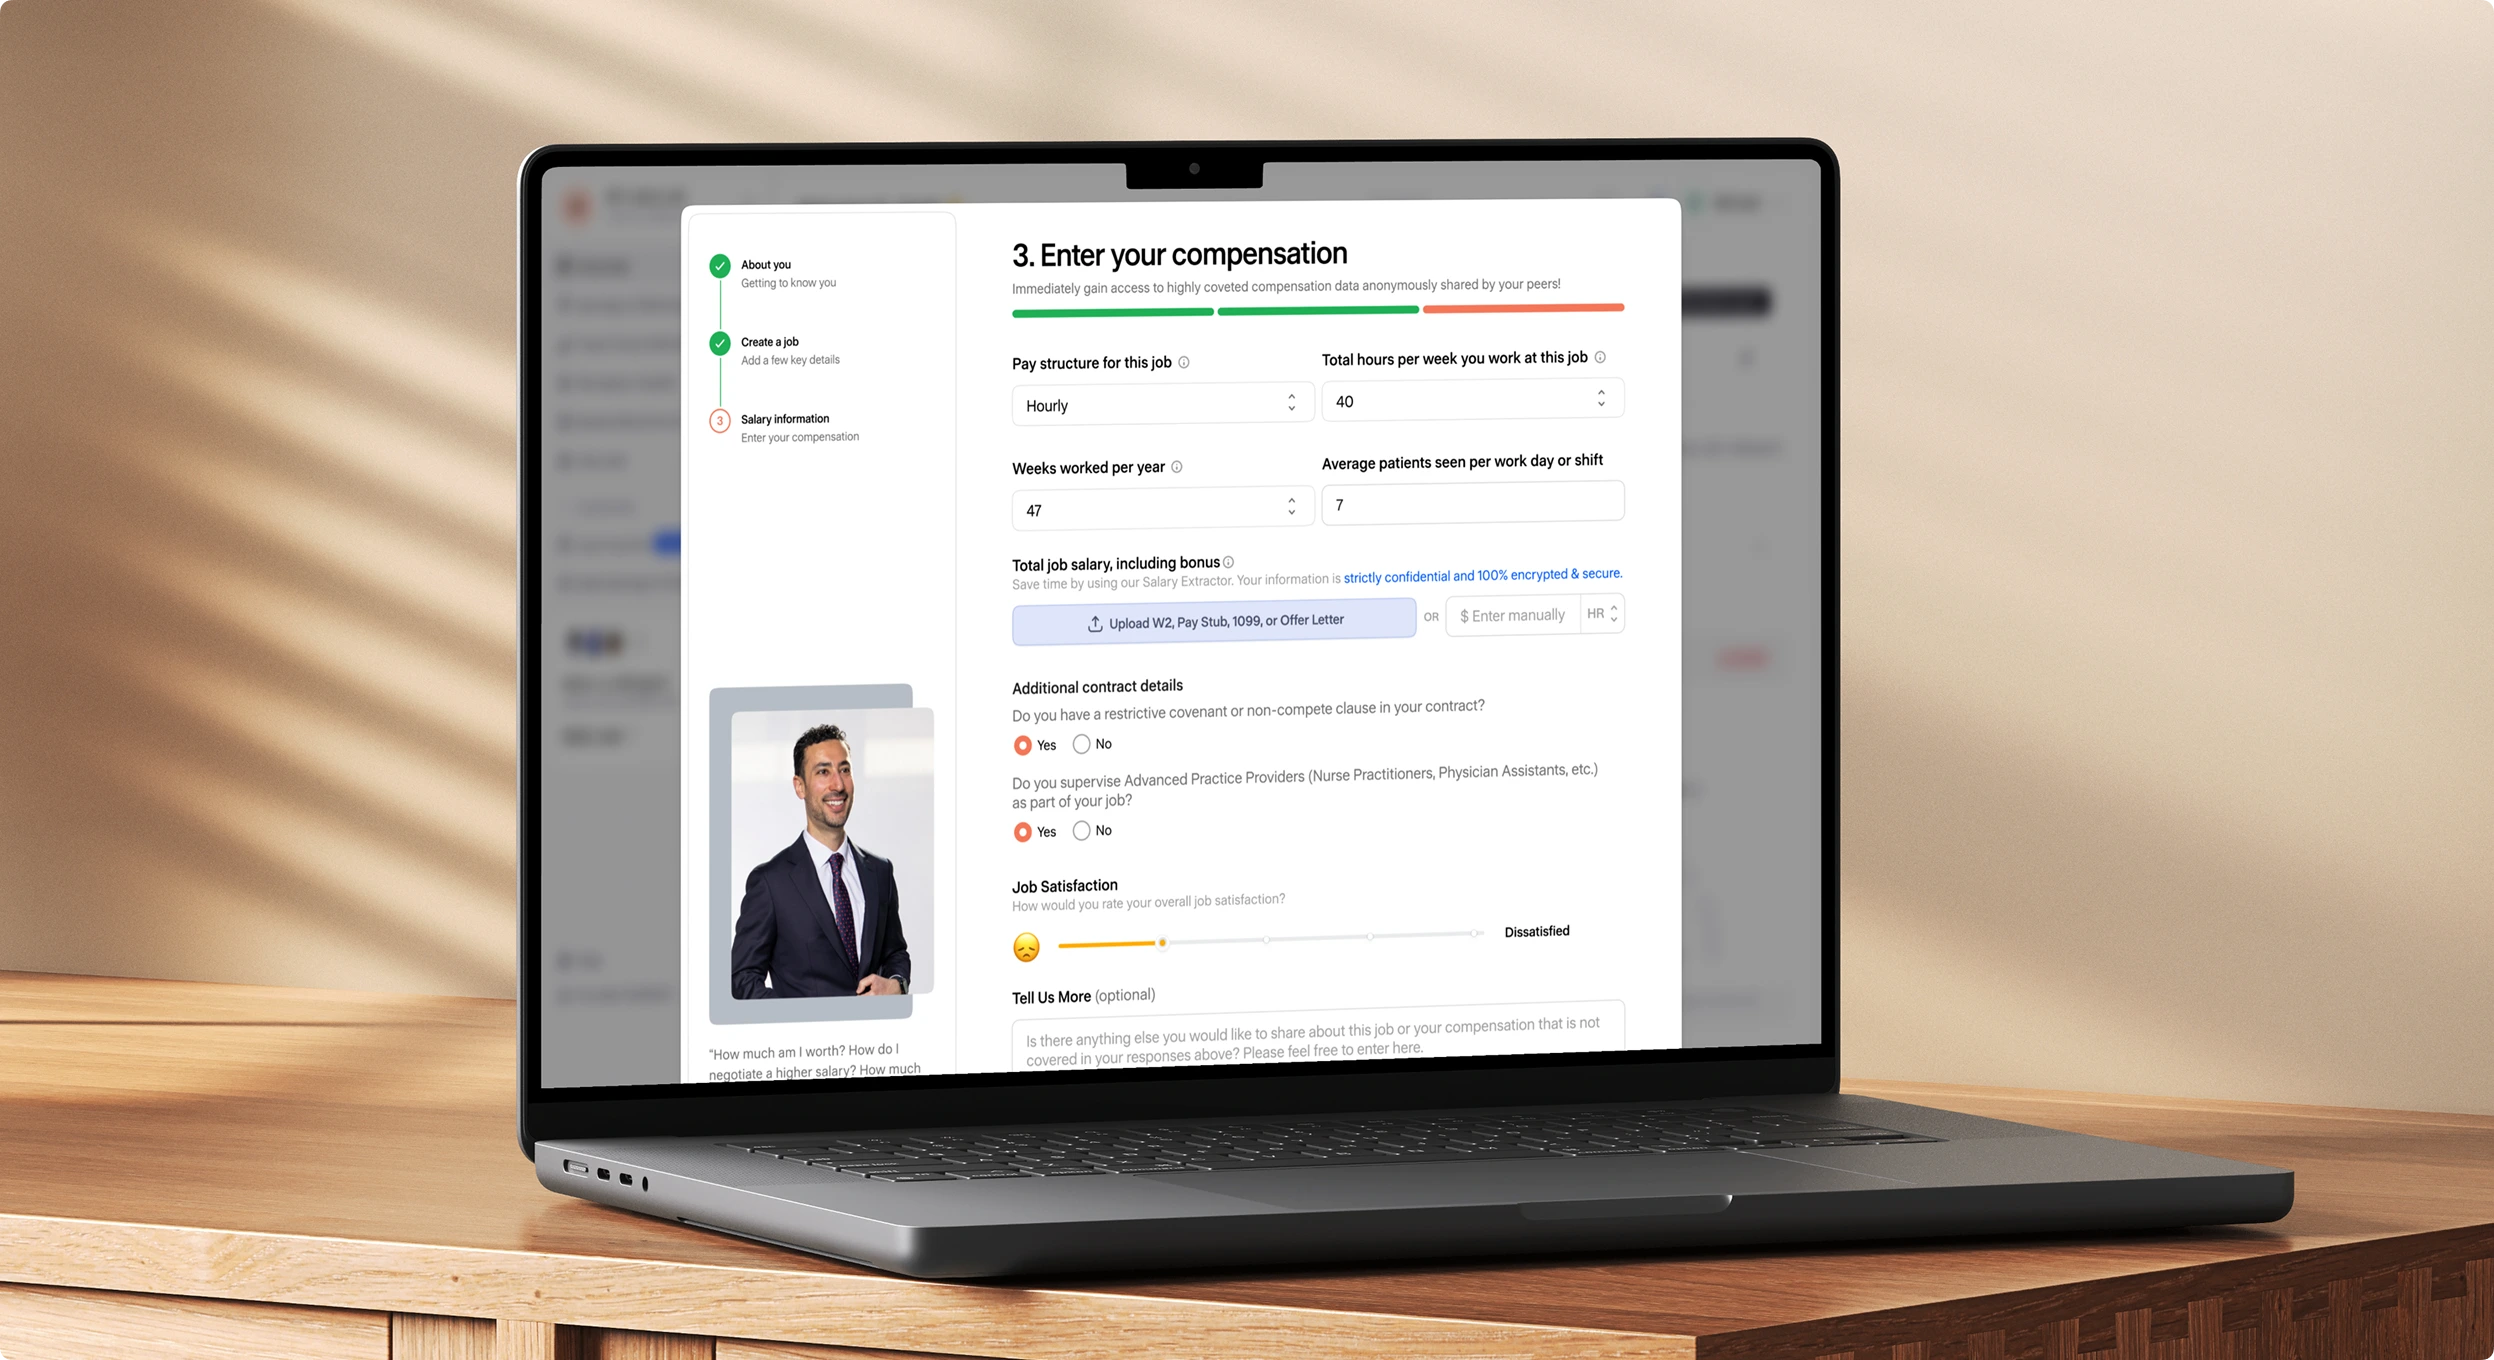
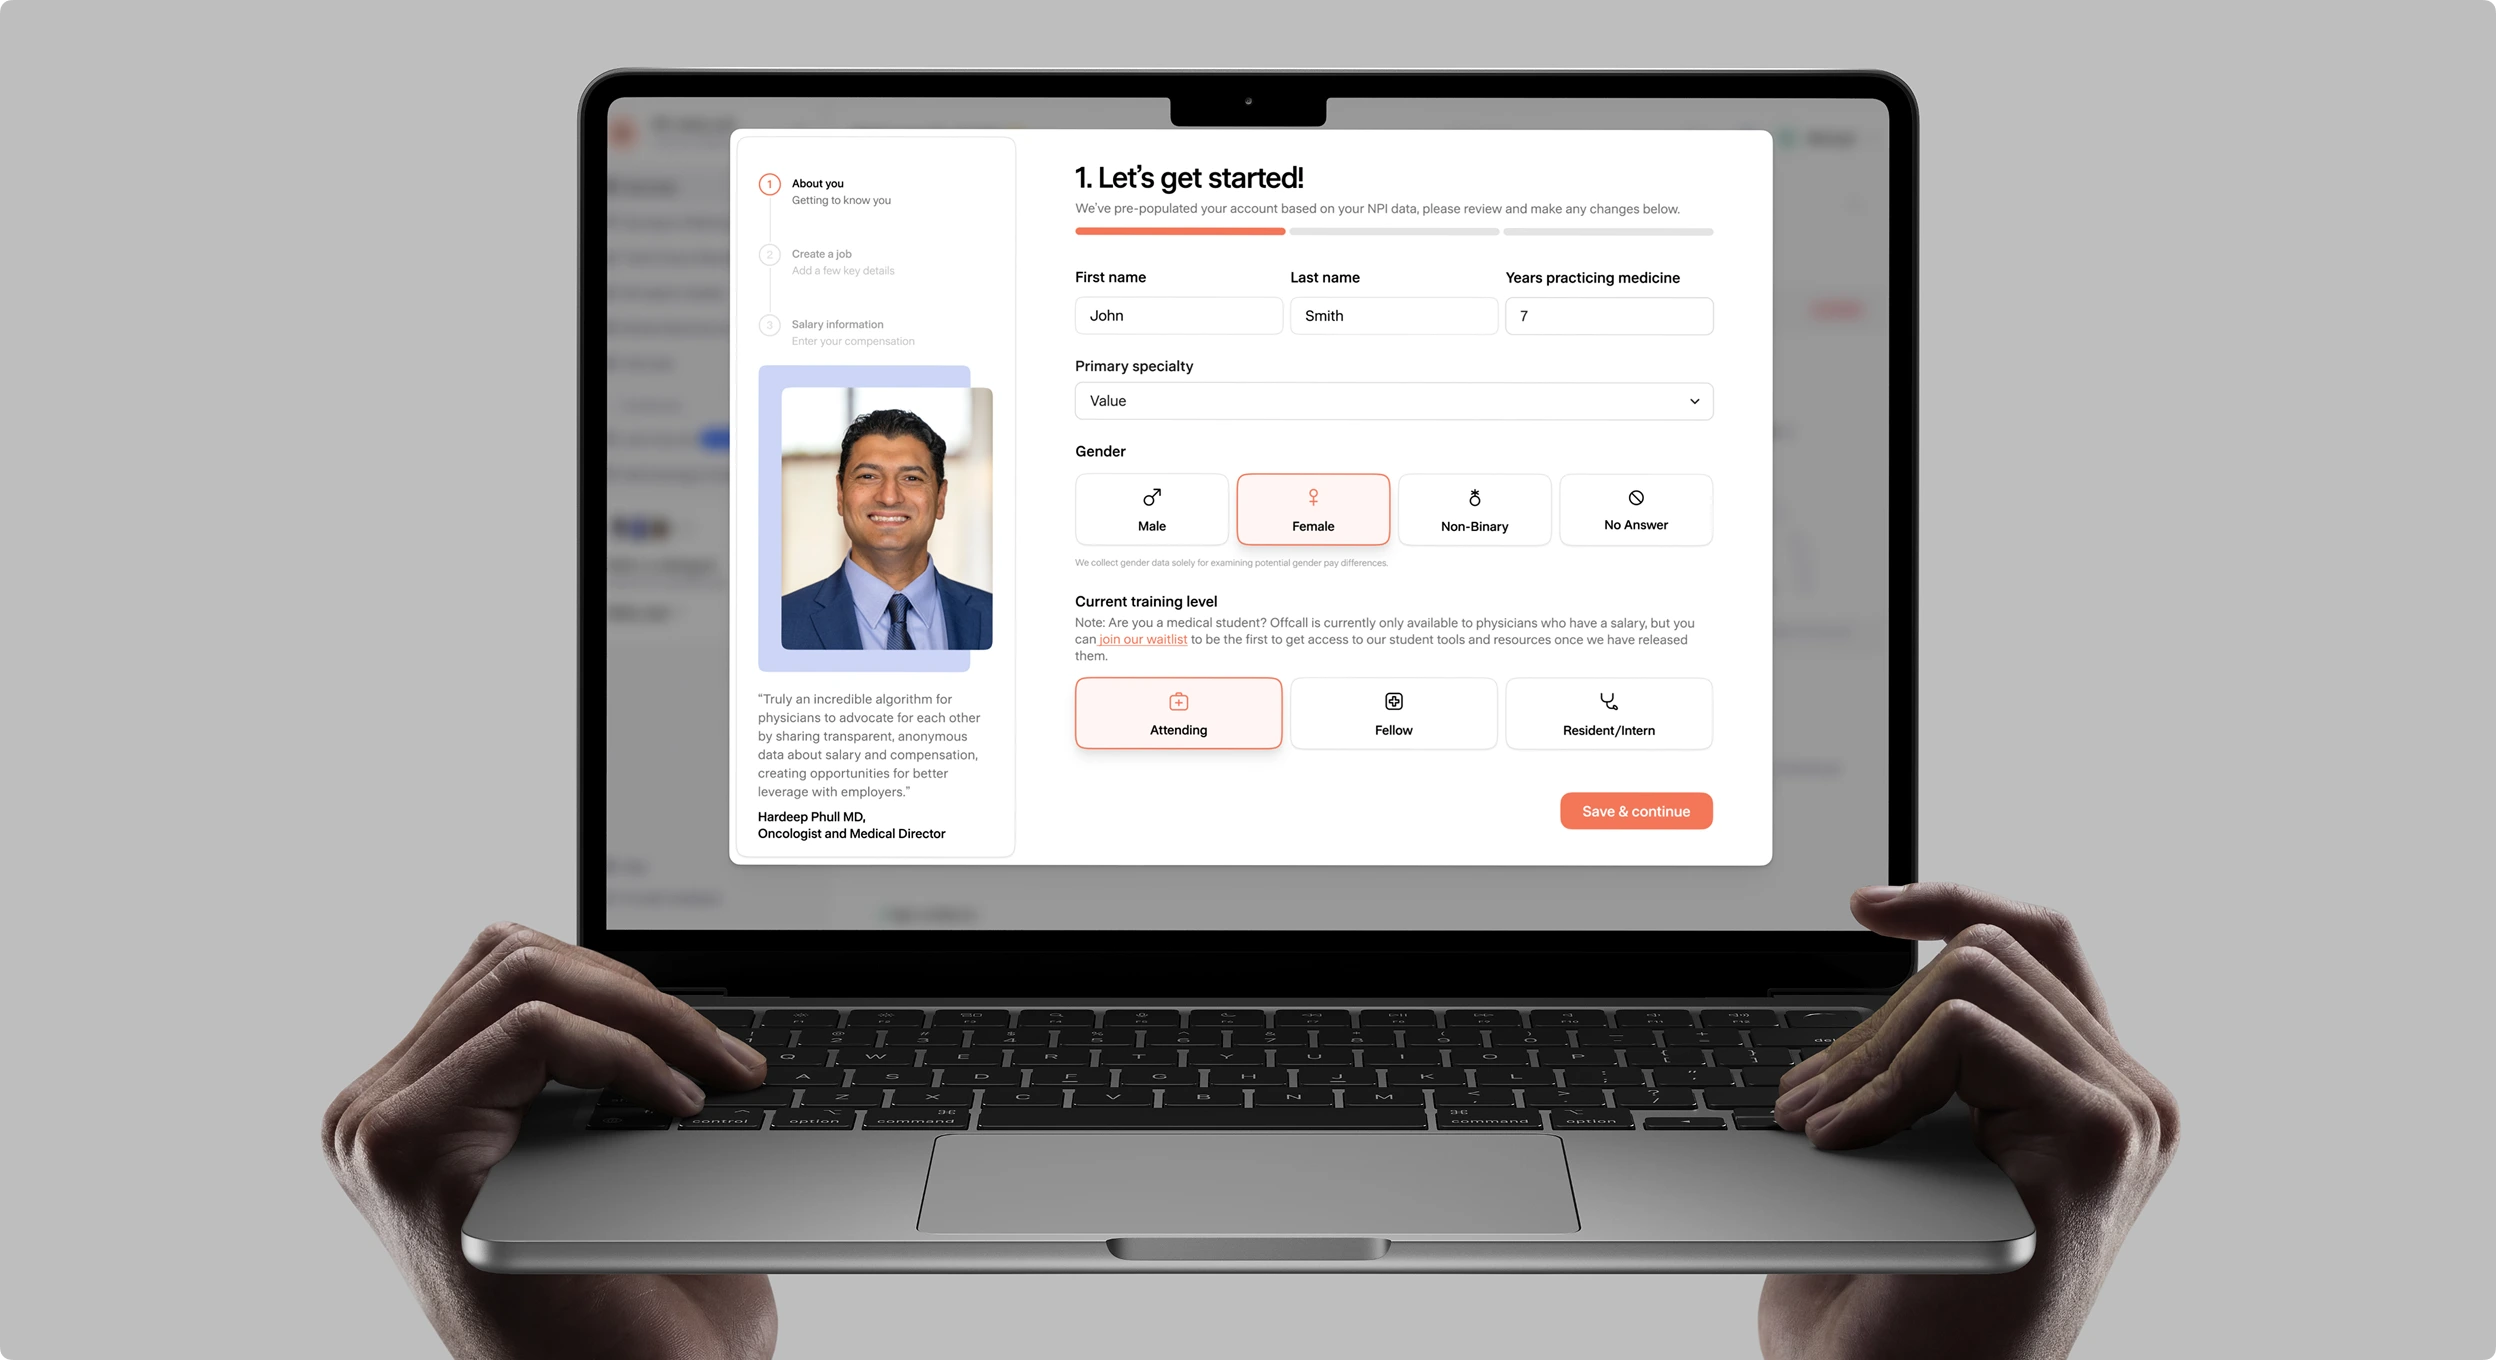
That is a lot of private information to ask for, so I put as much effort into how the dashboard asks as into what it asks. I didn’t cut questions. I changed how they are answered. Dropdowns and radio buttons became a visual guide, with icons and color wherever there were many options. Where a question asked how happy or unhappy someone was on a scale of one to five, I pushed for a slider with faces and color, so a clinician gets an immediate reaction and sees where they fall. Of the first 179 clinicians to sign up, 148 (83%) completed the compensation flow.
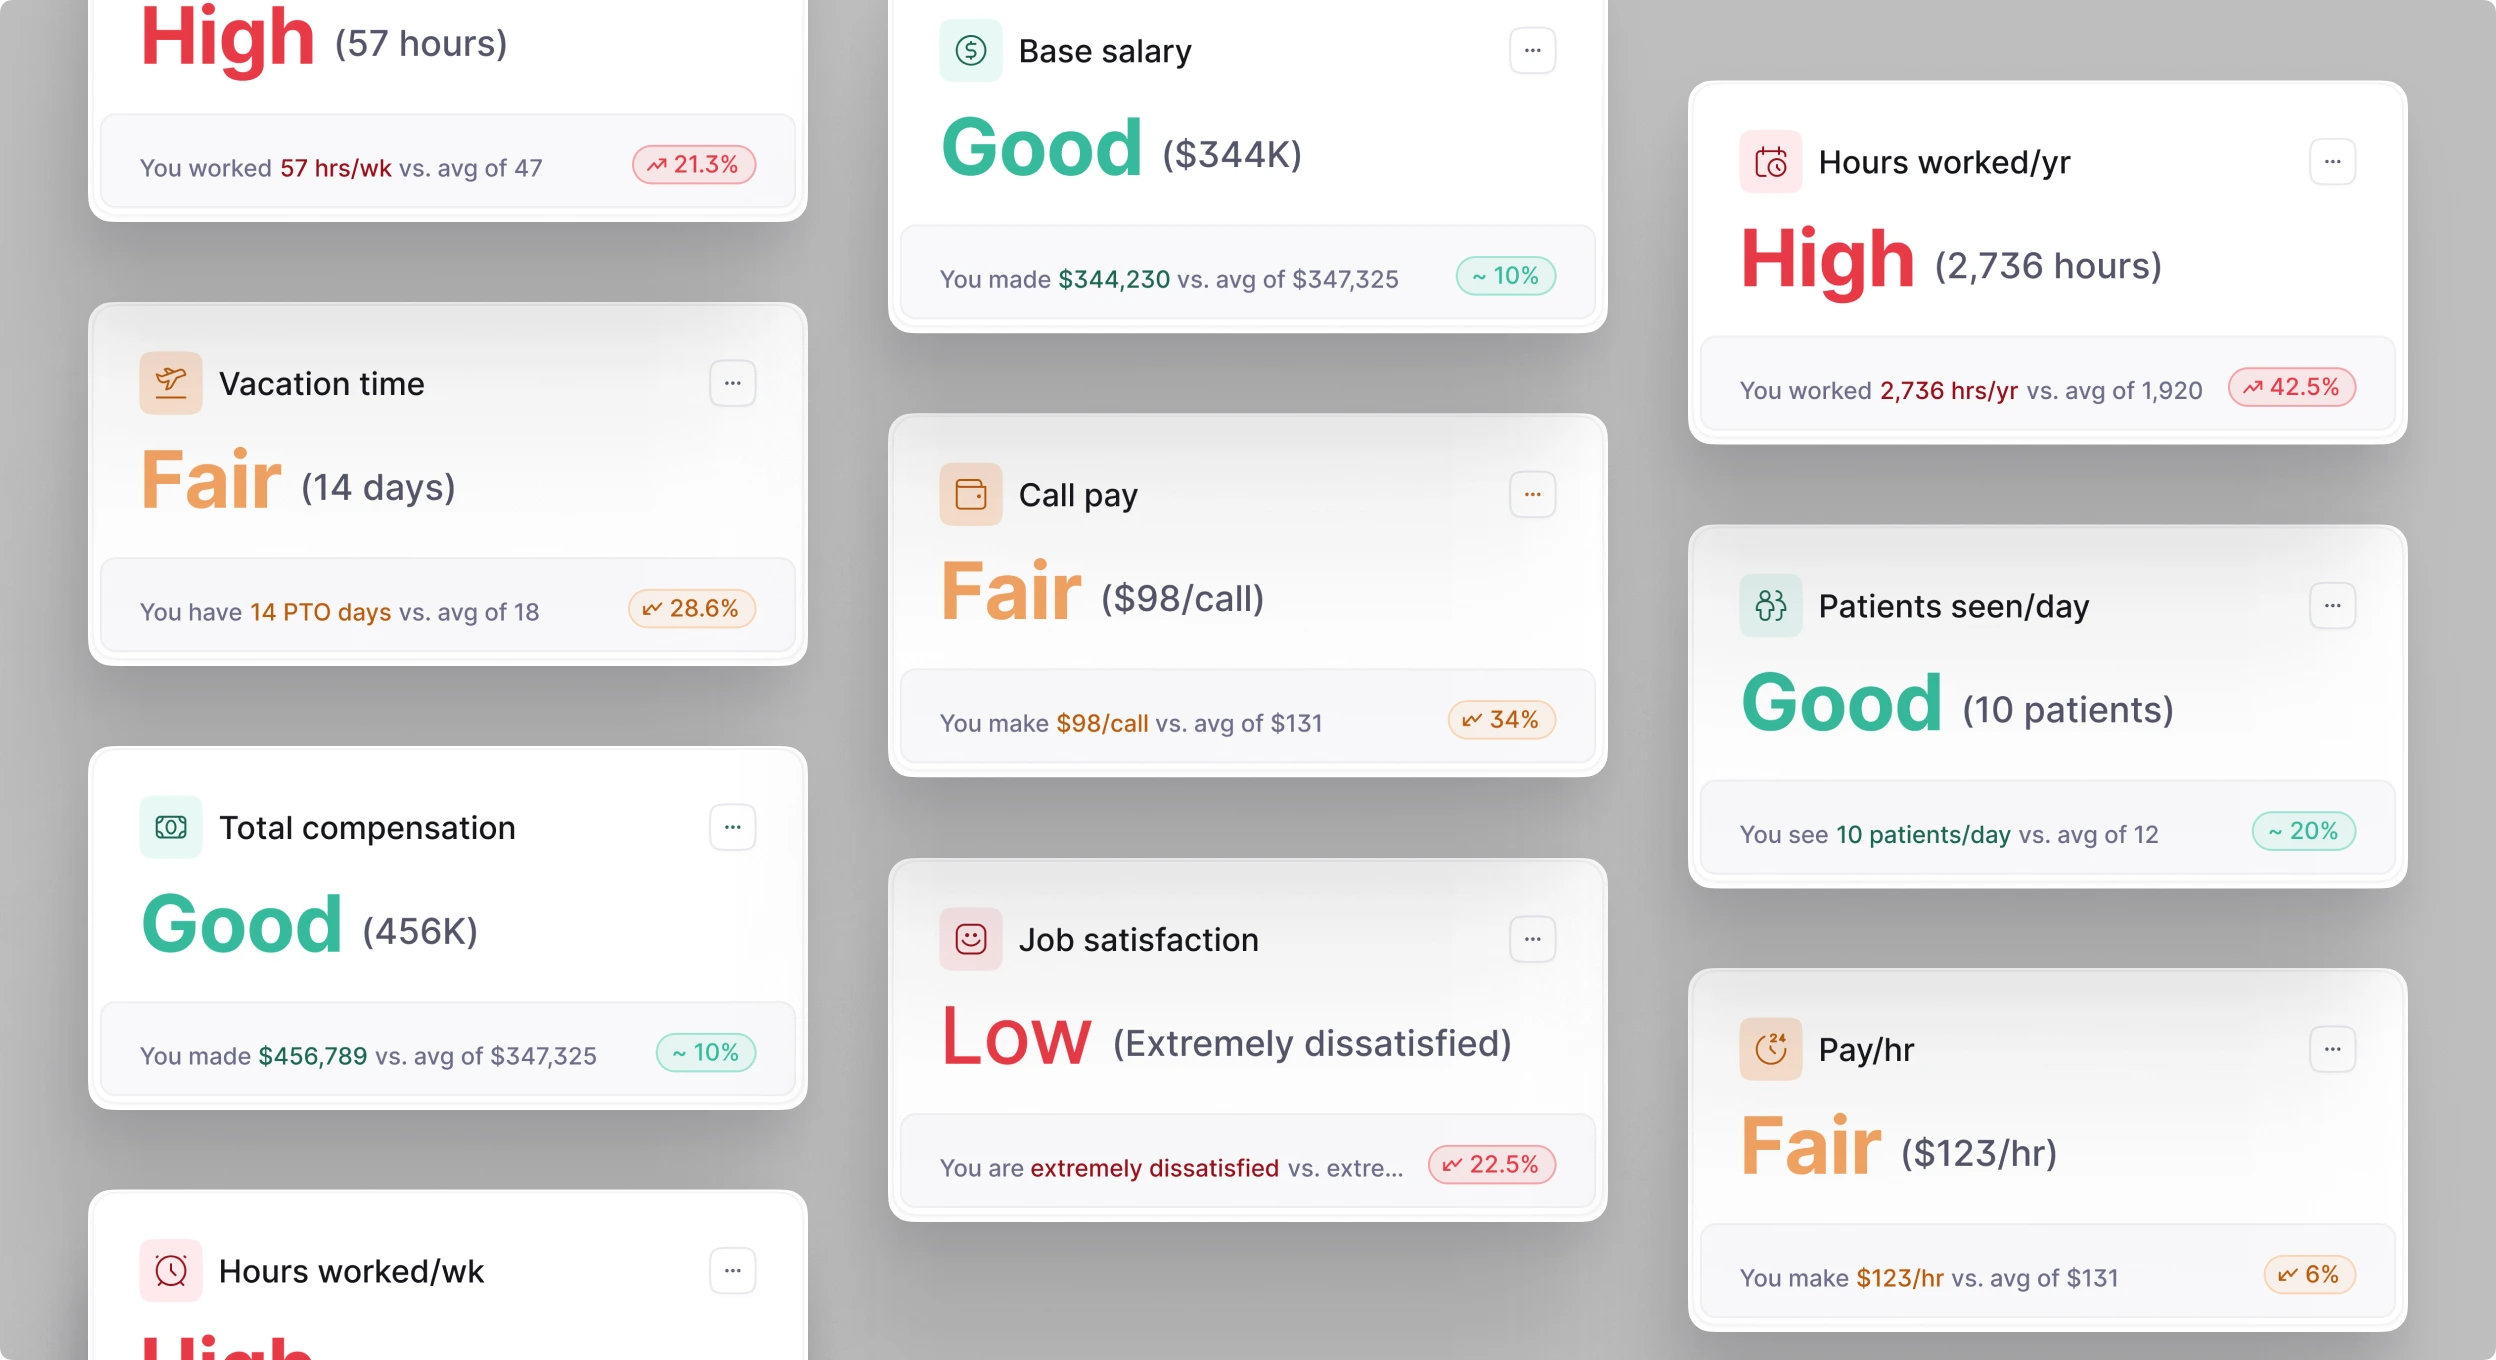
The second question is answered by the key takeaways section, which took more rounds than anything else. Each round was two to four layouts, reviewed with the team, narrowed to one or two, then revised. We did that two or three times, eight versions in all. The first led with the number, whether salary, hours or vacation, and left clinicians to work out from a small red, yellow or green arrow whether it was any good. The version that shipped says it outright: good, high or fair. The number is still there, much smaller. Everything a clinician needs is in one place, and none of it has to be decoded. Nobody argued against saying it that plainly. That was the point of the product.
Inviting a colleague didn’t unlock more data for the sender, at least not straight away. But every clinician who joins makes the peer groups larger and the answers more reliable for everyone.
The dashboard launched, then took a back seat when the team moved on to the mobile app, so the first clinicians’ feedback never made it back into the design. If I could go back, I would start with onboarding: fewer questions up front, and smaller, more frequent nudges that ask for a little more data at a time, so the dataset fills in more thoroughly.
A comparison is only as fair as who is in it, and only as useful as how plainly it answers.